

The Florida rental vacancy rate was 7.6% in the 2020-2024 American Community Survey, while the reported Q1 2026 Housing Vacancy Survey figure was 10.5%. Those figures describe different periods and surveys, so neither should automatically become your property’s vacancy allowance.
To estimate lost rent, multiply annual scheduled rent by your expected vacancy percentage. We recommend using local leasing conditions and the home’s turnover history to build that assumption, then budgeting carrying costs separately.
Start by separating statewide market conditions from the income your property can realistically collect.
Key Takeaways
- Florida vacancy figures differ because quarterly surveys, multiyear estimates, and total-housing studies measure different things.
- Calculate vacancy loss before subtracting operating expenses, debt payments, and planned reserves.
- Budget for utilities, lawn care, turnover work, and storm preparation even when the home produces no rent.
Florida Rental Vacancy Rates by County
The Florida rental vacancy rate varies by county, but county figures still combine different neighborhoods and property types. The Florida Health CHARTS vacancy table publishes Census ACS rental vacancy estimates.
These 2020-2024 ACS 5-year estimates show the differences across four Florida counties.
| Area | Rental Vacancy Rate |
|---|---|
| Florida | 7.6% |
| Manatee County | 14.1% |
| Charlotte County | 11.8% |
| Sarasota County | 6.1% |
| DeSoto County | 5.8% |
Manatee and Charlotte have the highest rates among these four counties, not necessarily across all Florida counties. Florida’s homeowner vacancy rate was 1.4% in the same ACS period.
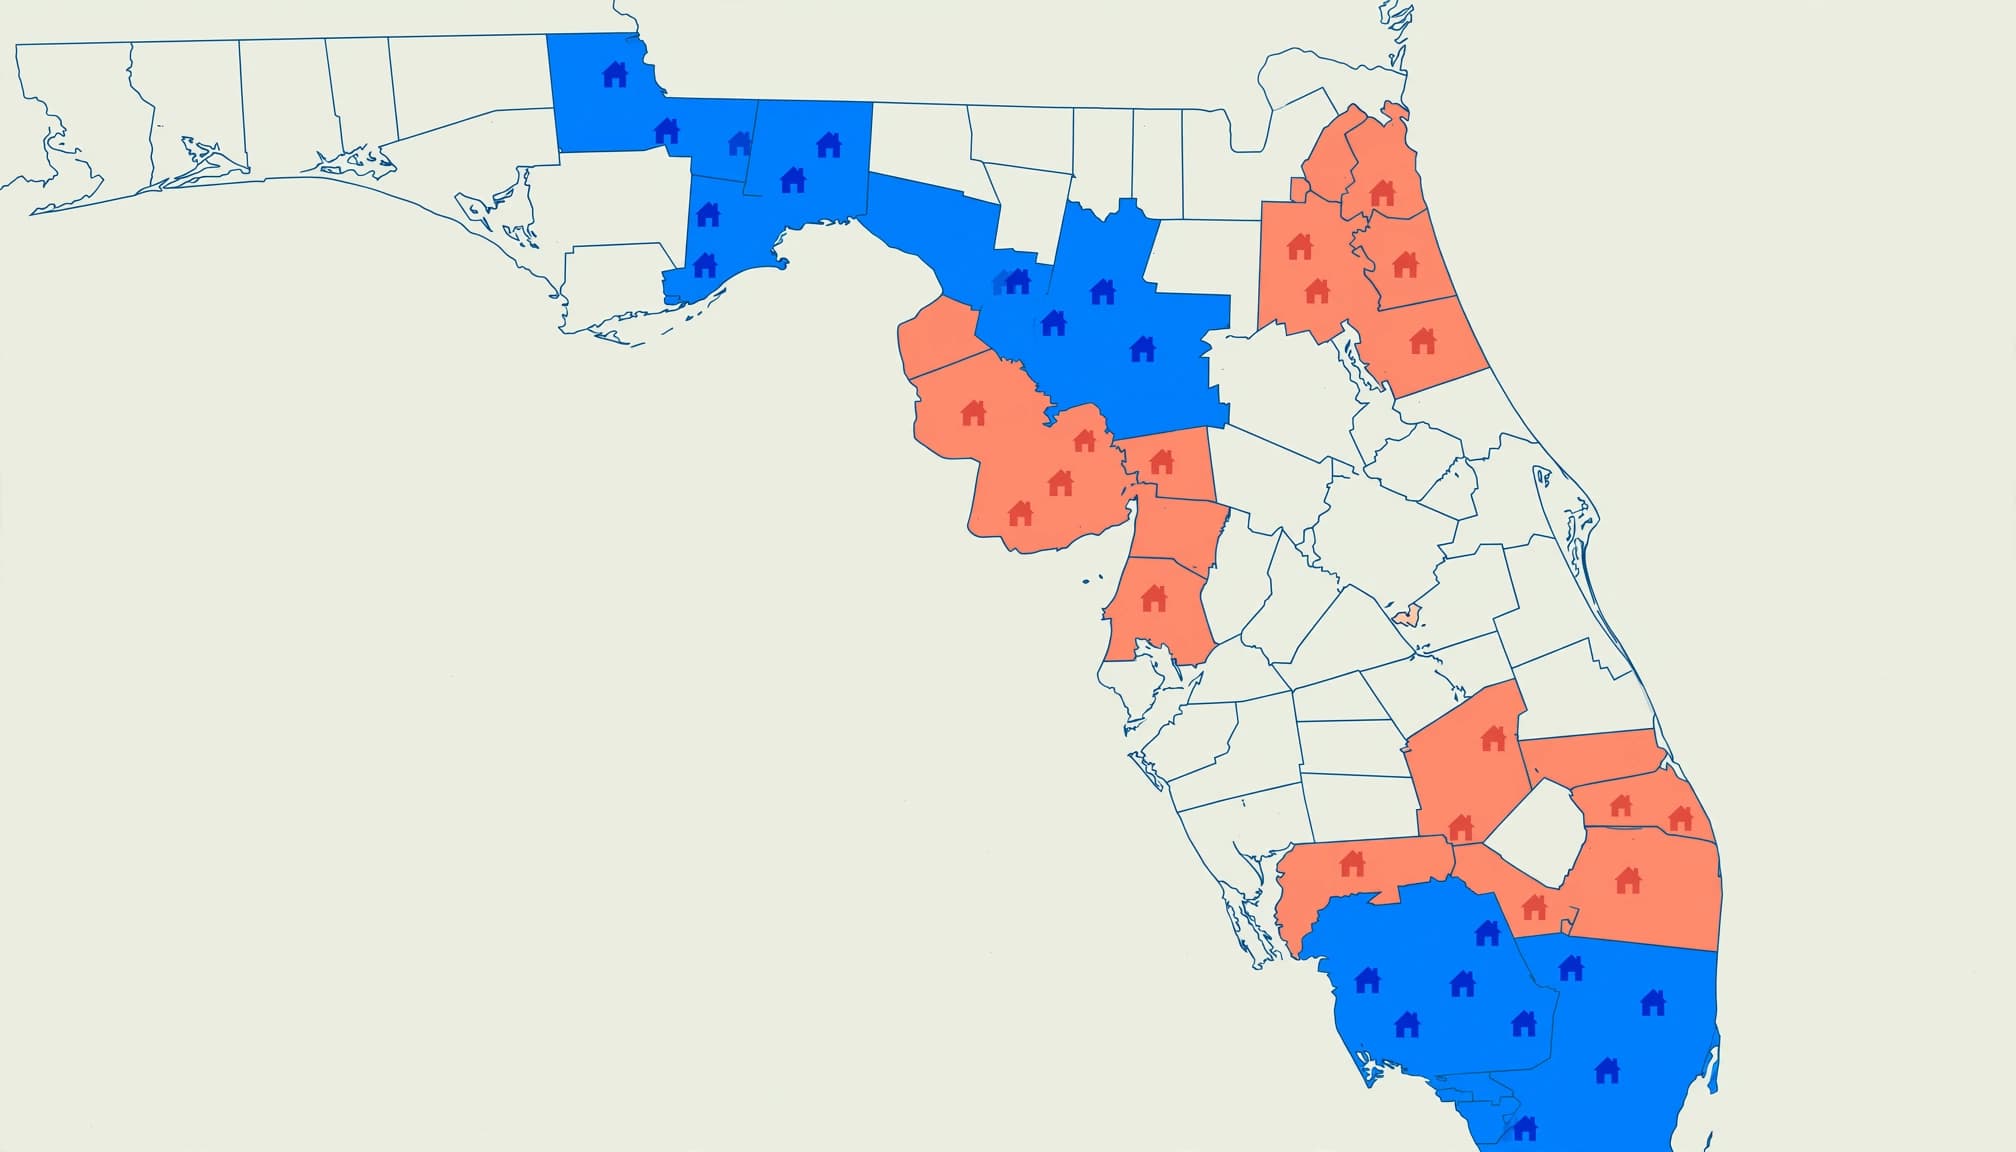
For a Port Charlotte investment, Charlotte County offers useful context. However, we wouldn’t apply 11.8% mechanically to every house. Comparable homes, achievable rent, and leasing time provide a stronger property-level forecast.
Why Florida Vacancy Headlines Disagree
Rental Vacancy Differs From Total Vacancy
Clever’s analysis ranked Orlando the most vacant among America’s 50 largest metros, with 15.3% of its housing stock unoccupied. Miami followed at 14.8%, Tampa at 13.7%, and Jacksonville at 11.9%.
Four of the seven metros above the national total-vacancy rate were in Florida. However, these are total housing vacancy figures, including categories beyond available rental homes.
The national figures were 11.6% total vacancy, 5.8% rental vacancy, and 1.4% for-sale vacancy. Orlando’s rental-only rate was 9.7%. The Scotsman Guide report on Orlando describes that ranking.
Official Vacancy Differs From Budgeted Downtime
Under the Census Bureau’s vacancy definitions, total vacancy includes vacant housing units beyond homes available for rent. Rental vacancy measures inventory vacant for rent, while the homeowner vacancy rate measures for-sale units relative to homeowner inventory.
Repair-related downtime needs additional care. A vacant home unavailable for rent because of substantial renovation can fall outside the official for-rent category. For your investment budget, however, those lost-income days still count.
Seasonal homes, properties held off-market, and rented units awaiting occupancy also require different treatment. That’s why a total-vacancy headline cannot tell you how much annual rent to deduct.
A renovation can create rental-income loss even when the property doesn’t count as vacant for rent in the official survey.
What Quarterly Florida Data Show
National Conditions Provide Context
The Census Housing Vacancy Survey has tracked vacancy quarterly for more than 40 years. Its quarterly vacancy reports provide a different view from multiyear ACS estimates.
The U.S. rental vacancy rate reached 7.3% in Q1 2026, compared with 7.1% in Q1 2025 and 7.2% in Q4 2025. Census reported that those differences weren’t statistically significant.
Vacancy data help federal agencies and economic forecasters assess housing conditions, but small quarterly movements don’t establish a lasting trend.
Metro Estimates Need Room for Uncertainty
The Census metro vacancy estimates show substantial differences across Florida’s major metropolitan areas. Each metropolitan area covers a defined region, so its estimate isn’t a county-level rate.
| Area | Q1 2005 | Q1 2026 |
|---|---|---|
| Florida | 11.0% | 10.5% |
| Jacksonville | 8.4% | 20.6% |
| Orlando | 9.2% | 6.6% |
| Miami | 8.9% | 6.6% |
| Tampa | 12.9% | 12.9% |
Jacksonville’s estimate deserves caution: its Q1 2026 margin of error was 7.2 percentage points. Metro boundary definitions also changed in Q1 2026, which complicates long-term comparisons.
When comparing rental vacancy rates by state for Florida, Maine, and South Carolina, use the same source, period, and geography. State and metro estimates aren’t interchangeable.
Property type matters, too. National Q1 2026 estimates put vacancy at 33.0% for units built from April 2020 onward and 9.5% for buildings with at least 10 units. Neither figure is a Florida single-family rental benchmark.
How to Calculate Vacancy and Lost Rent
Measure the Right Vacancy Rate
For a snapshot of a rental portfolio, use:
Vacancy rate = vacant rental units ÷ total rental units × 100
For one home, an annual time-based calculation is more useful:
Annual vacancy percentage = vacant days ÷ days in the year × 100
A portfolio with different rents needs a dollar-based calculation as well. An empty higher-rent home creates more income loss than an empty lower-rent home, even when both count as one vacant unit.
We recommend recording turnover dates, rent-ready dates, listing dates, and lease-start dates. Those records separate repair delays from marketing delays.
Convert Vacancy Into Dollars
Use this calculation when preparing the annual budget:
Estimated lost rent = monthly scheduled rent × 12 × vacancy allowance
At a $1,850 monthly rent assumption, scheduled annual rent is $22,200. A 5% vacancy allowance deducts $1,110, leaving $21,090 before other income and expenses.
One full vacant month costs $1,850 in gross rent at that rate. Therefore, a 5% allowance won’t cover a full month’s vacancy during that particular year.

Keep concessions and credit losses separate. A free-rent incentive reduces income without creating physical vacancy, while unpaid rent creates a collection loss in an occupied home.
Choose a Vacancy Allowance With a Stress Test
A 5% to 8% vacancy rate is a healthy range for rough screening in a reasonably balanced rental market, not a universal threshold. Below 5% can indicate tight supply and faster rent growth. Above 8% can signal oversupply that pressures rents.
Inventory, seasonal demand, rent levels, and property condition can change the picture. Tight supply can support rents and housing prices, while oversupply can pressure both.
A construction boom can add rental competition and affect projections, depending on local supply and demand. Renter affordability can also influence demand and leasing time. In Florida, seasonality and location can affect coastal or tourism-oriented areas differently from other locations. Use distinct assumptions for long-term, seasonal, and vacation rentals.
We recommend comparing multiple vacancy assumptions while holding scheduled rent constant.
| Vacancy Assumption | Lost Rent on $22,200 | Rent After Vacancy |
|---|---|---|
| 5% | $1,110 | $21,090 |
| 8% | $1,776 | $20,424 |
| 12% | $2,664 | $19,536 |
The difference between 5% and 12% is $1,554 annually before additional vacancy expenses. These are sensitivity calculations, not forecasts.
For a purchase decision, also stress-test lower achievable rent, higher insurance, repairs, and financing costs. We favor properties that remain workable under conservative conditions rather than depending on uninterrupted occupancy.
Include the Costs That Continue Without a Tenant
Vacancy loss measures missed gross rent. It doesn’t include mortgage payments, property taxes, insurance, HOA charges, or other bills that continue during an empty period.
Florida homes can also need utilities for air conditioning, lawn or pool service, inspections, and storm preparation. Meanwhile, turnover may require cleaning, paint, repairs, advertising, and leasing fees.
We keep routine refreshes, repair-heavy turnovers, and major rehabilitation separate because their costs and downtime differ.
After subtracting vacancy and credit losses, add other rental income to calculate effective gross income. Then use:
Cash flow = effective gross income minus operating costs, debt service, and planned reserves
Net operating income excludes debt service and planned reserves. Keeping those measures separate prevents a positive operating result from hiding negative cash flow after financing.
A vacancy allowance is also different from a cash reserve. The allowance reduces projected income; the reserve provides money to pay bills when income stops.
Reduce Avoidable Vacancy Without Overpricing
Accurate pricing starts with comparable homes, not the highest advertised rent. Compare bedrooms, size, condition, amenities, location, and lease terms. Recently achieved rents offer stronger evidence than asking prices alone.
A Cape Coral pool home shouldn’t share the same pricing assumptions as a basic Lehigh Acres rental. Likewise, countywide vacancy cannot explain every neighborhood’s demand.
We recommend preparing marketing while turnover work progresses, then using accurate photographs once the home is ready. Track inquiries and showing feedback alongside days available, because weak demand may reveal a pricing or presentation problem.
Consistent screening and responsive maintenance also support longer tenancies. However, reducing vacancy shouldn’t mean relaxing written qualification standards.
For owners who want coordinated pricing, leasing, and upkeep, we provide rental pricing and management support. The goal is dependable collected income, not an asking rent that leaves the property sitting empty.
Frequently Asked Questions
How Do You Find a Local Vacancy Rate?
Use Census HVS for quarterly state and major-metro estimates, and ACS for county comparisons. Then assess similar rentals and your property’s recorded downtime. Keep the source, period, and geography consistent.
Does Higher Vacancy Help Florida Renters?
Higher availability can give renters more choices and negotiating room. Landlords may offer concessions or reduce asking rents. However, a high metro estimate doesn’t guarantee lower rent for every neighborhood or property type.
Can Long-Term Vacancy Data Forecast Vacation Rentals?
Not reliably. Vacation rentals depend on booked nights, seasonal pricing, owner use, and booking costs. We recommend a separate monthly occupancy and revenue model rather than applying a long-term rental vacancy percentage to peak-season rates.
Build the Purchase Decision Around Lost Rent
The statewide figure provides market context, but your investment depends on achievable rent and property-level downtime. Use consistent data, calculate the income reduction, and keep carrying costs separate.
A dependable rental budget leaves room for vacancy before paying operating expenses, financing, and reserves. That approach gives you a clearer view of what the property can support before you commit.